Oracle Exadata Statistics in AWR report – Part 2 (Outliers)

This blog post is a continuation of the previous blog post titled , Oracle Exadata Statistics in AWR report – Part 1 (Basics). In this post we continue on to describe the performance details displayed in the section “Exadata Outlier Summary”.

Outlier Summary Cell Level

awex3-1

This section displays cells that have performance outliers. The Awr Views DBA_HIST_CELL_DISK_SUMMARY, and DBA_HIST_CELL_GLOBAL_SUMMARY contains samples for each cell, disk and flash card.
The individual sample values, the number of samples, the average, the square of the value are all stored. Using this data the mean and the standard deviation are calculated and the range is defined as the average + or – standard deviation. Cells that have values that are above the mean + standard deviation are displayed.

This section will help us identify cells that have performance metrics, which are outside of the standard operating norms of that cell.

Outlier Summary – Disk Level

awex3-2

This section displays Disks that have performance outliers. The Awr Views DBA_HIST_CELL_DISK_SUMMARY contains this info.The individual sample values, the number of samples, the average, the square of the value are all stored. Using this data the mean and the standard deviation are calculated and the range is defined as the average + or – standard deviation. Disks that have values that are above the mean + standard deviation are displayed.

This section will help us identify Disks (Flash or Hard disk) that have performance metrics, which are outside of the standard operating norms of that Disk.

Exadata OS IO Statistics – Outlier Cells

awex4-1

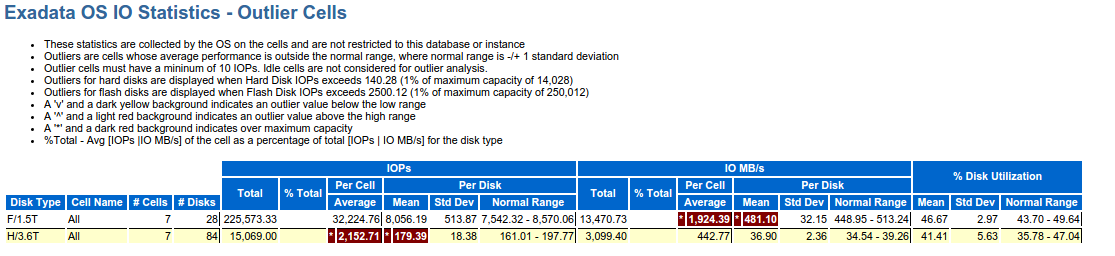
This section displays cells that have IO statistics that are outliers. Per Cells averages, Per Disk Mean, Standard Deviation, Range’s of the IOPS and IO MBPS information is displayed. Averages exceeding the maximum stated capacity of the disk or cell are shown in Dark red.

This section helps identify whether there are cells or disks that exceed their stated capacities.

Exadata OS IO Statistics – Outlier Disks

awex4-2

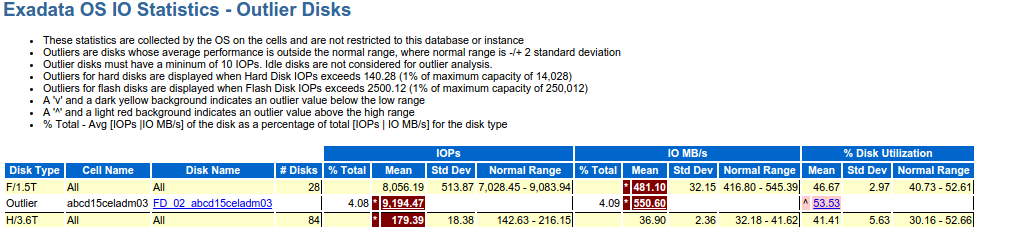
This section displays disks (Flash and Hard disk) that have IO statistics that are outliers. Per Disk Mean, Standard Deviation, Range’s of the IOPS, IO MBPS and Disk utilization percentage information is displayed. Averages exceeding the Normal Ranges are shown in Dark red.

This section helps identify whether there are disks that are outside of the standard operating norms of that disk.

Exadata OS IO Latency – Outlier Cells

awex4-3
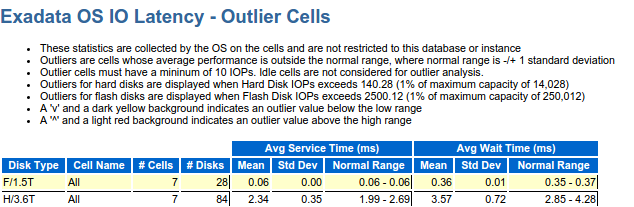
This section displays cells (Flash and Hard disk) that have IO latencies that are outliers.
Aggregated Across all cells, the Mean, Standard Deviation, Range’s of Average Serice times and Average Wait Times are displayed.
If there are cells Averages that exceed the Normal Range, they are displayed as outliers.

This section helps us identify whether there are cells that have I/O latencies that are outside of the standard operating norms for cells in this system.

Exadata OS IO Latency – Outlier Disks

awex5-1
This section displays disks (Flash and Hard disk) that have IO latencies that are outliers.
Aggregated Across all cells, the Mean, Standard Deviation, Range’s of Average Serice times and Average Wait Times are displayed.
If there are disks whose Averages that exceed the Normal Range of the cells, they are displayed as outliers.

This section helps us identify whether there are disks that have I/O latencies that are outside of the standard operating norms for disks in this system.
Exadata OS CPU Statistics – Outlier Cells

awex5-2
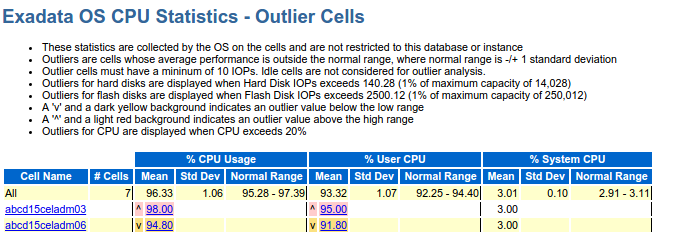
This section displays cells that have Cpu utilization that are outliers.
Aggregated Across all cells, the Mean, Standard Deviation, Range’s of Cpu utilization is displayed.
If there are cells whose Average Cpu utilization that exceed the Normal Cpu utilization Range of the cells, they are displayed as outliers.

Oracle Exadata Statistics in AWR report – Part 1 (Basic Info)

Starting with Exadata storage server 12.1.2.1.0 , used in combination with Oracle Database release 12.1.0.2, there are new sections which have been added to the Oracle AWR (Automatic Worload repository) report, that displays statistics at the Exadata storage level.

This is a really valuable enhancement, which helps with drilling down from database level statistics to cell level statistics, to identify and analyze the workload profile.
You can click on the URL’s in the section “Exadata Configuration and Statistics” to access this part of the report.

There are a few AWR history tables that store this information.

DBA_HIST_CELL_CONFIG
DBA_HIST_CELL_CONFIG_DETAIL
DBA_HIST_CELL_DB
DBA_HIST_CELL_DISKTYPE
DBA_HIST_CELL_DISK_NAME
DBA_HIST_CELL_DISK_SUMMARY
DBA_HIST_CELL_GLOBAL
DBA_HIST_CELL_GLOBAL_SUMMARY
DBA_HIST_CELL_IOREASON
DBA_HIST_CELL_IOREASON_NAME
DBA_HIST_CELL_METRIC_DESC
DBA_HIST_CELL_NAME
DBA_HIST_CELL_OPEN_ALERTS

The description of these views can be found in the Exadata Storage Server Users Guide.

The section starts off by showing the cell configuration information. Then it displays the Kernel  and the Cell Image version’s.

awex1-1

This information comes from the awr view DBA_HIST_CELL_DISK_SUMMARY.

The next section titled “Exadata Storage Information” storage information shows the number of disks and flash cards in each cell and the entire rack.

awex1-2
The first row of the output shows the amount of flash cache in each cell, The size of the smart flash log, Number of hard disks in a cell, Number of flash cards in each cell, and the number of Grid Disks in each cell.
The second row shows the above columns aggregated for all cells in the rack.

The next section titled “Exadata Griddisks” shows the grid disk names, Number of Grid disks in each cell, the Grid Disk size and The type of Drive

awex1-3
The next section titled “Exadata Cell Disks” shows the Disk type, Size of the cell disk, Number of disks .

awex2-1
The next section “ASM disksgroups” shows the diskgroups used by this database.

awex2-2
It shows the diskgroup name,Total size of the diskgroup,Used space, Number of disks in the diskgroup and the redundancy type.

This is followed by a section “Exadata Server Health Report”, which has 3 sub sections Exadata Alerts Summary,Exadata Alerts Detail,Exadata Non-Online Disks which displays information regarding alerts on the cells and any offline disks.
The remaining sections of Exadata performance statistics in the AWR report, display a great deal of Exadata cell performance numbers.

Before we venture much into those sections, it is important to understand some cell level concepts and how they are captured in Awr.

At the cell level if you list the following attributes (On a x5-2 cell with HD drives)

list cell attributes maxpdiops,maxpdmbps,maxfdiops,maxfdmbps you get the following values

167 111 8929 343

These values are collected and stored in the confval column in DBA_HIST_CELL_CONFIG_DETAIL in an XML format.

These base values are used to calculate the maximum capacities of the cells and disks in the sections that follow.

AWR – Profiling Database I/O

Oracle Awr (Automatic Workload Repository) statistics, captures and stores fine grained information about file reads and writes (aka i/o), that the database performed, during the course of execution of, application generated database workloads. When analyzing the read and write patterns of the database, it helps a lot to understand what type of activity is generating the reads and writes. With this stored information we can get an indepth understanding of the distribution of random and sequential reads and writes.

I use this information for getting a better understanding of the I/O profile, for my Exadata sizing exercises.

This information can be used to understand clearly how much of the i/o is from Temp activity, Datafile reads and writes, Archivelog writes, log writes, and whether these are small or large reads and writes.

To the best of my understanding the small reads and writes are those < 128k and the large reads and writes are those > 128k.

This information is contained mainly in two awr Views.

Dba_Hist_Iostat_FileType
Dba_Hist_Iostat_Function

Dba_Hist_Iostat_FileType

This view displays the historical i/o statistics by file type. The main filetypes are the following

Archive Log
Archive Log Backup
Control File
Data File
Data File Backup
Data File Copy
Data File Incremental Backup
Data Pump Dump File
Flashback Log
Log File
Other
Temp File

Dba_Hist_Iostat_Function

This view displays the historical i/o statistics by i/o function. The main i/o functions are the following

Recovery
Buffer Cache Reads
Others
RMAN
Streams AQ
Smart Scan
Data Pump
XDB
Direct Writes
DBWR
LGWR
Direct Reads
Archive Manager
ARCH

From everything i have seen sofar, these reads and writes can be directly co-related to the “Physical read total IO requests” and “Physical write total IO requests” system level statistics.

I have written a script that displays information from the above mentioned views and gives a detailed breakdown of i/o gendrated from different aspects of the database activities.
In order to fit in the computer screen real estate, i have actually limited the columns the script displays (So it displays only the file types i am frequently interested in). Please feel free to take the script and modify it to add columns that you want to display.

The full version of the script  awrioftallpct-pub.sql can be found here.

The script accepts the following inputs
– A begin snap id for a snapid range you want to report for
– A End snap id for a snapid range you want to report for
– A Dbid for the database
– The snap interval in seconds (If you have a 30 minute interval input 1800 seconds)

A description of all the column names in the output, broken down by section, is provided in the header section of the script.

There are 6 sections to this script

1) Total Reads + Writes
2) Total Reads
3) Total Writes
4) Read write breakdown for datafiles
5) Data File – Direct Path v/s Buffered Read Write breakdown
6) Read write breakdown for tempfiles

1) Total Reads + Writes

This section displays the number of reads+writes by filetype, and a percentage of reads+writes for each file type, as a percentage of total reads+writes. The last column displays the total reads+writes for all file types. The column DTDP shows the i/o that bypasses flash cache by default and goes directly to spinning disk on Exadata (Temp+Archivelogs+Flashback Logs).

io1-rw

Click on the image to see a larger version

2) Total Reads

This section displays the number of reads by filetype, and a percentage of reads for each file type, as a percentage of total reads. The last column displays the total reads for all file types.

io1-r

Click on the image to see a larger version

3) Total Writes

This section displays the number of writes by filetype, and a percentage of writes for each file type, as a percentage of total writes. The last column displays the total writes for all file types.

io1-w

Click on the image to see a larger version

4) Read write breakdown for datafiles

This section displays the I/O information only pertaining to datafile i/o. It displays the small and large reads and writes and a percentage they constitute of the total reads+writes to datafiles, and a percentage they constitute of the total reads or writes to datafiles. It also displays the total small and large reads and writes and a percentage they constitute of the total reads+writes to datafiles.

io1-dfrw

Click on the image to see a larger version

5) Data File – Direct Path v/s Buffered Read Write breakdown

This section provides a breakdown of I/O by function (As opposed to i/o by filetype in the previous sections). The output shows columns that display the direct path small and large reads and writes, buffered small reads and writes, smart scan small and large reads and other small and large reads and writes.

io3-bf

Click on the image to see a larger version

6) Read write breakdown for tempfiles

This section displays the I/O information only pertaining to tempfile i/o. It displays the small and large reads and writes and a percentage they constitute of the total reads+writes to tempfiles, and a percentage they constitute of the total reads or writes to tempfiles. It also displays the total small and large reads and writes and a percentage they constitute of the total reads+writes to tempfiles.

io3-tf

Click on the image to see a larger version

The full version of the script  awrioftallpct-pub.sql can be found here.

Exadata Database Machine Specifications – Quick Reference

With the different combinations of the Oracle Exadata database machines and storage expansion racks available to customers, it is hard for me to remember, each system’s specifications.

So i have created a JavaScript page, that can be used to quickly lookup the specifications of the current generation (x3-8 and x4-2) of Exadata database machines and storage expansion racks.

The page can be accessed from a web browser from your desktop,laptop, or favorite mobile device at http://dbastreet.com/exaspecs

You can narrow the results down by the exadata rack size, type of disk, and type of specification (cpu, storage or performance).

Here is a screenshot

exaspecs

Exadata X4-2 Whats New – A Technical Review


On Dec 11 2013 Oracle corporation announced the general availability of, the 5th generation of the Oracle Exadata Database Machine X4. This new version of the database machine introduces new hardware and software to accelerate performance, increase capacity, and improve efficiency and quality of service for database deployments.

In this blog post i’ll review in detail the enhancements in the Oracle Exadata x4-2 database machine.

The 2 socket version of the Database machine, X4-2 gets new database servers and new storage servers. The 8 socket version of the database machine, still called the x3-8, gets the new storage servers but keeps the same database serves from the previous release. Hence the Lack of change in Name to the X4-8. The name stays as X3-8.

Improvements in the database servers (X4-2)

Cpu Improvements

The database servers in the x4-2 are the Sun X4-2  servers. They come with the 2 Twelve-Core Intel® Xeon® E5-2697 v2 Processors (Ivy Bridge) (2.7GHz), with turbo boost enabled by default. This cpu at times can clock upto 3.5Ghz.

Comparing this with the previous version x3-2, this is a 50% increase in number of cores per database server. The x3-2 had 16 cores per node and the x4-2 has 24 cores per node. In a x3-2 full rack there were 128 cores and in the x4-2 full rack there are 192 cores. That gives 64 more cores in the x4-2 full rack compared to the x3-2 full rack.

Memory Improvements

Each database server has 256Gb of Dram. This is optionally expandable to 512Gb per node.So you can have either 2Tb or 4Tb of Ram in a full rack of x4-2.

Storage Improvements

The database servers now have 4, 600Gb hard disks in them (Internal storage, used for O/S, Oracle Binaries, Logs etc). The x3-2 used to have 300Gb disks. The disk controller batteries are online replaceable

Network Improvements

The database servers have 2 X Infiniband 4 X QDR (40Gb/S) Ports (PCIe 3.0). Both ports are Active. The improvements in the x4-2 are that these are now PCIe 3.0, and that the ports are used active active. (The ports were used Active/Passive in the previous release)

Improvements in the storage servers (Exadata cells x4-2)

Cpu Improvements

Each x4-2 exadata cells come with 2, Six-Core Intel® Xeon® E5-2630 v2 Processors (2.6 GHz).

Memory Improvements

Each x4-2 cell, now has 96Gb of Ram. The x3-2 used to have 64 Gb of Ram.

Flash Cache Improvements

The Exadata x4-2 cells, now have the F80 PCIe Flash cards. There are 4, 800Gb F80 flash cards in each cell. So each cell has 3.2Tb of flash cache. In an Oracle Exadata database machine x4-2 full rack there is 44TB of flash cache (Used to be 22Tb in the x3-2). The Oracle Exadata database machine x4-2 full rack now provides, 2.66Million read iops , 1.96Million write iops from the flash cache. This is 70% more flash iops than the previous generation.

Storage Improvements

The Exadata cell x4-2 High Performance version, now uses 1.2Tb 10k Rpm High Performance SAS disks.

  • A full rack of High Performance disks gives 200TB of raw space, 90TB of usable space with normal mirroring and 60TB of usable space with High Mirroring

The Exadata cell x4-2 High Capacity version, now uses 4Tb 7.2k Rpm High Capacity SAS disks.

  • A full rack of High Capacity disks gives 672TB of raw space, 300TB of usable space with normal mirroring and 200TB of usable space with High Mirroring

The Disk controller batteries are online replacable.

Network Improvements

The Exadata storage servers have 2 X Infiniband 4 X QDR (40Gb/S) Ports (PCIe 3.0). Both ports are Active. The improvements in the x4-2 are that these are now PCIe 3.0, and that the ports are used active active. (The ports were used Active/Passive in the previous release)


Software Improvement Highlights

The new x4-2’s get a new version of the exadata storage server software version 11.2.3.3.0 (This version of the cell software can be installed on the v2,x2,x3 and x4 platforms).

Exadata Flash Cache Improvements

Data written to the flash cache is now compressed. This compression is done by the controller (Hence near Zero overhead). This data is automatically decompressed when it is read from the flash cache. Up to 2X more data fits in smart flash cache (If you get 2x compression of the data, you could fit upto 80TB of data on the flash cache), so flash hit rates will improve and performance will improve for large data sets. This feature can be turned on in both x3-2 and x4-2 storage servers. Customers need to license the Advanced Compression option to use this new feature.

Enhancements to the smart flash cache software, enables exadata software to understand database table and partition scans and automatically caches them when it makes sense (This will help eliminate the need to specify CELL FLASH CACHE KEEP).

Exadata network resource management

With a new version of the Infiniband switch firmware 2.1.3-4, Exadata network resource management now prioritizes messages through the entire infiniband fabric. Latency sensitive messages like redo log writes are prioritized over batch, reporting and backup messages.

Infiniband Active Active Ports

Double-ported infiniband PCIe-3.0 Cards used in the database servers and storage servers, implement active-active mode usage of the infiniband ports, providing a 80GigaBits Per Second network bandwidth (Used to be 40Gigbits ber second on the x3-2, since it was Active Passive bonding).

The Rdbms software and the clusterware software already had the ability to send packets via multipe interfaces. Enhancements have been done to the RDS kernel drivers, which now have the ability to sense if one of the ports is down, and route the network traffic through the surviving port. On the x4-2’s when active active Infiniband networking is setup you will not see the bondib0 interface, instead you will see a ib0 and ib1.

Miscellaneious Info

  • The power,cooling and airflow requirements remain similar to that of the x3-2.
  • The storage expansion racks have also been refreshed and provides the increased flash cache and increased disk space.
  • A single Database Machine configuration can have servers and storage from different generations V2, X2, X3, X4.
  • Databases and Clusters can span across multiple hardware generations.
  • The half and full x4-2 racks, do not ship the spine switch anymore. The storage expansion racks still ship with the spine switch.
  • A new One Command available through patch 17784784 has the new Exadata Deployment assistant that supports the x4-2’s.

Datasheets and White Papers

Datasheet: Oracle Exadata database machine x4-2

Datasheet: Oracle Exadata database machine x3-8

Datasheet: Oracle Exadata storage expansion Rack x4-2

Datasheet: Oracle Exadata storage server x4-2

A Technical Overview of the Oracle Database Machine and Exadata Storage Server (Updated for x4-2)

Exadata Smart Flash Cache (Updated For X4-2)


Graph CPU usage on exadata using oswatcher files

On the oracle database machine, oswatcher is installed during setup time, both on the database nodes and the exadata cells. This utility collects linux operating system level statistics, which comes in very handy when troubleshooting operating system level issues. The data is collected in text files. There is a Java based utility (OSWG) provided by oracle support to graph the contents of these files, however that utility does not work on the oswatcher files generated on exadata.

Here is a python script that can graph the cpu used from the mpstat information that oswatcher captures. It has been tested on new oswatcher files on an x3-2. You need to first install a python environment that has the “numpy” and “matplotlib” modules installed.

Install a Python Virtualenv.

If you create multiple applications using Python and end up using different versions, it is easier to maintain different virtualenv’s. You can create a python virtualenv as shown below (On ubuntu linux).

curl -O https://pypi.python.org/packages/source/v/virtualenv/virtualenv-1.9.1.tar.gz
tar -xzvf virtualenv-1.9.1.tar.gz
cd virtualenv-1.9.1
python virtualenv.py ../p273env2
. p273env2/bin/activate
pip install numpy
sudo apt-get install libfreetype6-dev
pip install matplotlib

Now that you have a python environment, with your required libraries, you can go ahead and execute the script as shown below.

The oswatcher files in /opt/oracle/oswatcher are .bz2 files and there will be one file per hour per day. Copy the mpstat .bz2 files into a directory and use bunzip2 to unzip them. In this example let us say that the directory name is /u01/oswatcher/mpstat/tmp

You can now run the script as shown below

python parseoswmp.py  /u01/oswatcher/mpstat/tmp
or
python parseoswmp.py  /u01/oswatcher/mpstat/tmp '06/14/2013 05:00:00 AM' '06/14/2013 07:00:00 AM'

The first command will graph the cpu usage for the entire time range in all those files and the second command graphs the cpu information for the date and time range you have specified.

It creates a file in the current directory, named oswmpstat.png, which has the graph.

You can find the full script here.

You can find a sample output graph here.

Exadata Deployment Assistant

Previously, for an Oracle database machine installation, customers had to fill out the configuration worksheet, with information regarding the hostnames, ip addresses, how they want the machine configured etc. The file generated from the configuration worksheet served as the input to OneCommand.

Now there is a new utility called the “Exadata Deployment Assistant”. This is a java based, wizard driven configuration file generator, which replaces the configuration worksheet. You can get the utility by downloading the latest OneCommand Patch. You can find the latest OneCommand patch by referring to the Onecommand section of Mos Note 888828.1.

You can also find the latest Oracle Exadata Deployment Assistant at http://www.oracle.com/technetwork/database/exadata/oeda-download-2076737.html

Download and unzip the patch.

cd linux-x64

./config.sh

The details of the command, and the inputs it looks for are in the chapter titled “Using Oracle Exadata Deployment Assistant”, in the latest “Exadata database machine Owner’s guide”.

Oracle database machine x3-2

The Oracle database machine, gets a major makeover. As Larry Ellison phrased it in his Openworld 2012 Keynote, “Thought that the x2-2 was fast ? You Aint seen nothin Yet”.

If you go to http://www.oracle.com/technetwork/server-storage/engineered-systems/exadata/index.html, at the middle of the page, in the section titled “What’s New”, you can see a in depth technical discussion of the changes incorporated in the x3-2.

So without further Ado, let me explain what the changes are, in the x3-2 compared to the x2-2

Hardware Improvements

Faster CPU’s/More Cores.

– The Oracle Database Machine x3-2, uses the Intel Xeon E5-2690 Processors (2.9Ghz). 2 Sockets, 8 cores each, total 16 cores in each database node (The x2-2 had 12 cores per node). These are the Sandy bridge processors (x2-2 had the Intel Xeon westmere processors), which have a new micro architecture, and are extremely fast (Comparable in speed to the IBM Power7 cpu’s).

So now in the full Rack of x3-2, the database machine has 128 CPU Cores (The x2-2 had 96 Cores).

– The CPU’s on the exadata cells have been upgraded to use the Intel Xeon E5-2630L (2.0Ghz) Sandybridge processors. The Cpu’s are 6 cores each.

More Physical Memory (DRAM)

– The Oracle Database Machine x3-2 has 128Gb of DRAM memory per database server. This is expandable to 256Gb of Memory. So in the Full Rack you can have upto 2048Gb (2Tb) of physical memory.

– The physical memory on the x3-2 exadata cells, has been upgraded to have 64Gbytes of Ram.

More 10GigE networking ports

– The 4 Networking ports on the database server, mother board are now 1/10Gbe. They are autosensing,and are copper only. The remaining 2 Network ports are 10Gbe and can be connected via fiber.

More Flash Cache.

– The x3-2 exadata storage servers now use the Sun F40 Flash cards instead of the Sun F20 Flash cards used in the x2-2. Each Card is 400Gb. There are 4 PCI-E Flash cards in each cell. So you have 1600Gbytes of Flash cache in each cell. In a full rack x3-2, you get 22.4Tb of Flash cache (The x2-2 had 5Tb of Flash cache in a full rack).

So what does this increased amount of Flash mean in terms of performance ?

On an x3-2 full rack, you can get
– 1.5 Million datatase read iops from the flash cache.
– 1 Million database write iops from flash cache
– 100Gbytes/sec Flash Cache, scan throughput

New 1/8th Rack

A new configuration (In addition to the Full, Half & Quarter configurations) of a 1/8th Rack has been announced. So customers can now buy a configuration smaller than the quarter rack. It is really a 1/4th rack with half the cpu’s, half the flash cards and half the disks turned off. So the hardware price is lower and the software licensing costs are lower.

The other improvements include lower power consumption and improved cabling and airflow.

One notable change is that, the x3-2 now, does not have a KVM. This leaves 2U at the top of the Rack, where customers can deploy their in home switches, for network connectivity.

The number of disks, the type of disks, the disk capacities and speeds, in the exadata x3-2 cells,remain the same as it was in the x2-2 cells.

Software Improvements

Exadata Smart Flash Cache Write-Back

With the improved write speeds of the new PCI-E flash cards, the flash cache can now used as a write-back cache. This means that as soon as the data is written to flash cache, oracle database considers the write complete (ie it does not have to wait till the data is written to the physical magnetic disk). This helps improve the performance of applications that are currently bottlenecked on database writes.

On the x2-2, the random writes were written to the flash cache too, however it had to be written to disk (Or strictly speaking, to the disk controller cache) before the write was acknowledged by the database as completed. With the write-back cache functionality in x3-2 as soon as the write is persisted in the flash cache the database considers the write as complete. The writes to disk only get done when the ESS software detects that new blocks need to be read from disk to the flash cache and there is no free space in the flash cache. At such times, least frequently used data from the flash cache gets written to physical disk.

The smart flash cache algorithm makes sure that things like backups do not overwrite the entire cache.

The Full Rack x2-2 can do 1 million write iops to flash cache using this new functionality.

Reduced database brownout time during cell failure/removal.

In previous versions of the ESS software there could be upto 8 seconds of brown out time, when a cell failed, which has been now reduced to sub second.

Unbreakable Enterprise Kernel

– The database servers and Exadata storage servers on the x3-2 now use Oracle Unbreakable Enterprise Kernel 1.

The UEK1 was the operating system on the x2-8’s for a while now. With the x3-2’s we now use the UEK Kernel on the x3-2 database and storage server.

DBFS

– DBFS now supported on Solaris and Sparc Super Cluster.

The above list of hardware and software changes are just the highlights, not a complete list.

Exadata smart flash log

The exadata development team has now released the exadata cell software version 11.2.2.4.0, which includes a new feature called the “Smart Flash Log”.

In a nutshell, this new feature speeds up redo log writes. Exadata smart flash log uses Exadata smart flash cache as a temporary storage to provide low latency redo log writes. With this new feature enabled, oracle writes both to physical disk and the flash cache simultaneously.

So if for some reason, flash cache writes are slow, the writes to the physical disk will provide the good response times. Similarly if the physical disk writes are slow, the flash cache writes will complete faster, providing the good response times.

You can use the “Create flash log”, cell command to turn this feature on. You can use the “Drop flash log” cell command to turn this feature off.

The exadata storage server software, users guide, has been updated with this information.

You have to have Bundle patch 11 (Actually it works from BP9 onwards, but BP11 is recommended) and exadata cell software 11.2.2.4.0 applied to get this functionality.

Please read the section “Exadata Smart Flash Logging : Flash for database logging”, in the oracle technical white paper, Exadata smart flash cache features and the Oracle Exadata Database Machine, for details.

Here is a video tutorial produced by Oracle Education on this topic, smart flash log.

Monitoring Exadata database machine with Oracle Enterprise Manager 11g

Oracle Enterprise manager Grid control, is hands down the best monitoring and management tool, for the oracle exadata database machine. It comes with plugins to monitor all the hardware components of the database machine, and sensible, preset thresholds for proactive monitoring.

Update (Nov 2011) : Enterprise manager 12c is now available, and Certified to be used with exadata. The master MOS note 1110675.1 covers the installation and configuration details.

Some key points
  • You should use 11gR1 enterprise manager grid control for monitoring.
  • You should use 11gR1 enterprise manager agents, to monitor the targets on the database machine.
  • If you use enterprise wide monitoring tools like tivoli, openview or netcool, use snmp traps from oracle enterprise manager, to notify these monitoring tools (ie dont try to directly use snmp to monitor the exadata components. You could do this but it will be too time consuming).
  • You could potentially use 10.2.0.5 Oem, with 11g agents to monitor the dbmachine, but this is not recommended as a stable/long term solution.
  • The following components (And more) can be monitored using Enterprise Manager
    • Databases hosts
    • Exadata Cells
    • Cisco switch
    • KVM (Keyboard, Video, Mouse)
    • ILOM Monitoring
    • Infiniband switch
    • Power distribution unit (PDU)
You have 3 possible options to configure enterprise manager
  • If you have an existing 11gR1 enterprise manager grid control envrionment, you can patch it with the recommended patches and use that for monitoring the dbmachine targets.
  • You can setup and configure a brand new 11gR1 enterprise manager grid control environment (On a separate server) and configure it to monitor the dbmachine targets.
    • Download the required software
      • Weblogic server 10.3.2 (MOS Note 1106105.1, 1063112.1)
      • Jdk 64 bit (Mos Note 1063587.1)
      • 11gR1 Oms from download.oracle.com
    • Install Java and Web Logic Server (Wls)
      • MOS Note 1063762.1
    • Patch Web Logic Server
      • MOS Note 1072763.1
    • Install 11gR1 Enterprise manager Oracle Management Server (OMS)
      • Install/Create a 11gR2 database to serve as the Enterprise Manager Repository
      • Database pre-reqs for 11.1.0.1 repository (Mos Note 1064441.1)
      • Install/Configure Oms (Mos Notes 1130958.1, 1059516.1)
    • Patch OMS with the required patches to enable database machine monitoring
      • Mos Note 1323298.1
  • You can use an easy install option to setup and configure an enterprise manager environment and configure the plugins.
    • The easy install is delivered as a  patch 11852882 (EMGC setup automation kit)
    • The configuration worksheet has to be filled out properly (Before the installation) and the em.param file has to be generated.
    • Follow the instructions in the readme to do a quick install of a fully configured 11gR1 Enterprise manager installation.
    • This method helps you install/patch  and configure the full 11gR1 oms in just an few steps and is a huge time saver.
Download the required plugins to monitor the following components
Download the plugins from the enterprise manager extensions exchange
http://www.oracle.com/technetwork/database/exadata/index.html#plug-in (Exadata cell plugin)
http://www.oracle.com/technetwork/oem/grid-control/exadata-plug-in-bundle-188771.html (All the rest of the plugins)
Install and Configure the Agent and the Plugins
       Additional tutorials with screenshots on configuring the plugins can be found below
Sending SNMP traps to 3rd party monitoring tools.
  • Get the Mib (Management Information Base) file from your enterprise manager management server and send it to the 3rd party tool administrator (eg: openview or netcool). Follow MOS note 389585.1, to get this MIB file.
  • Then configure your notification methods and rules to send the required snmp traps to the 3rd party tool.