Starting with Exadata storage server 12.1.2.1.0 , used in combination with Oracle Database release 12.1.0.2, there are new sections which have been added to the Oracle AWR (Automatic Worload repository) report, that displays statistics at the Exadata storage level.
This is a really valuable enhancement, which helps with drilling down from database level statistics to cell level statistics, to identify and analyze the workload profile.
You can click on the URL’s in the section “Exadata Configuration and Statistics” to access this part of the report.
There are a few AWR history tables that store this information.
DBA_HIST_CELL_CONFIG
DBA_HIST_CELL_CONFIG_DETAIL
DBA_HIST_CELL_DB
DBA_HIST_CELL_DISKTYPE
DBA_HIST_CELL_DISK_NAME
DBA_HIST_CELL_DISK_SUMMARY
DBA_HIST_CELL_GLOBAL
DBA_HIST_CELL_GLOBAL_SUMMARY
DBA_HIST_CELL_IOREASON
DBA_HIST_CELL_IOREASON_NAME
DBA_HIST_CELL_METRIC_DESC
DBA_HIST_CELL_NAME
DBA_HIST_CELL_OPEN_ALERTS
The description of these views can be found in the Exadata Storage Server Users Guide.
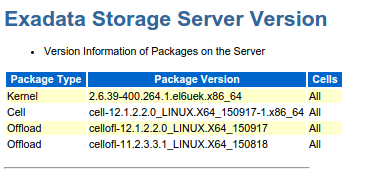
The section starts off by showing the cell configuration information. Then it displays the Kernel and the Cell Image version’s.
This information comes from the awr view DBA_HIST_CELL_DISK_SUMMARY.
The next section titled “Exadata Storage Information” storage information shows the number of disks and flash cards in each cell and the entire rack.

The first row of the output shows the amount of flash cache in each cell, The size of the smart flash log, Number of hard disks in a cell, Number of flash cards in each cell, and the number of Grid Disks in each cell.
The second row shows the above columns aggregated for all cells in the rack.
The next section titled “Exadata Griddisks” shows the grid disk names, Number of Grid disks in each cell, the Grid Disk size and The type of Drive

The next section titled “Exadata Cell Disks” shows the Disk type, Size of the cell disk, Number of disks .

The next section “ASM disksgroups” shows the diskgroups used by this database.

It shows the diskgroup name,Total size of the diskgroup,Used space, Number of disks in the diskgroup and the redundancy type.
This is followed by a section “Exadata Server Health Report”, which has 3 sub sections Exadata Alerts Summary,Exadata Alerts Detail,Exadata Non-Online Disks which displays information regarding alerts on the cells and any offline disks.
The remaining sections of Exadata performance statistics in the AWR report, display a great deal of Exadata cell performance numbers.
Before we venture much into those sections, it is important to understand some cell level concepts and how they are captured in Awr.
At the cell level if you list the following attributes (On a x5-2 cell with HD drives)
list cell attributes maxpdiops,maxpdmbps,maxfdiops,maxfdmbps you get the following values
167 111 8929 343
These values are collected and stored in the confval column in DBA_HIST_CELL_CONFIG_DETAIL in an XML format.
These base values are used to calculate the maximum capacities of the cells and disks in the sections that follow.